Why are American cities running out of water while it rains elsewhere?
Why are American cities running out of water while it rains elsewhere?
While cities like Cape Town narrowly avoided "Day Zero" in 2018 and Chennai's reservoirs ran completely dry in 2019, American metropolitan areas from Phoenix to Miami face their own water crises despite abundant precipitation falling elsewhere on the continent[1]. The fundamental disconnect between where water falls and where people need it has created a complex web of engineering, political, and environmental challenges that threaten the sustainability of America's largest urban centers.
This water distribution puzzle reflects deeper systemic issues: aging infrastructure built for different climate patterns, political barriers to inter-regional water transfers, and the mounting pressures of climate change reshaping precipitation patterns across North America. Understanding why Phoenix can experience severe drought while Seattle receives record rainfall requires examining the intricate relationships between geography, governance, and growing urban populations.
The Geography of American Water Distribution
The United States receives approximately 4.2 trillion gallons of precipitation daily, yet this water falls unevenly across the continent[2]. The Pacific Northwest, Great Lakes region, and Southeastern states receive abundant rainfall, while the Southwest and much of California experience chronic water stress. This mismatch between supply and demand has intensified as population centers have grown in historically arid regions.
Las Vegas exemplifies this geographic challenge. The city receives only 4.2 inches of annual rainfall, yet supports a metropolitan population of 2.3 million people[3]. Meanwhile, Mobile, Alabama receives 67 inches annually but supports fewer than 200,000 residents. The Colorado River, which supplies water to seven states including Nevada, Arizona, and California, has experienced a 23-year drought that reduced Lake Mead to just 27% of its capacity as of 2024[4].
Phoenix presents perhaps the starkest example of this imbalance. The city has grown from 106,000 residents in 1950 to over 1.7 million today, despite receiving only 8.3 inches of annual precipitation[5]. The metropolitan area relies on a complex system of canals, including the Central Arizona Project, which transports Colorado River water across 336 miles of desert. When the Colorado River entered Tier 1 shortage conditions in 2022, Arizona lost access to 18% of its allocated water supply[6].
California's Central Valley demonstrates how agricultural demands compound urban water stress. The region produces 40% of America's fruits, vegetables, and nuts while experiencing severe groundwater depletion[7]. Cities like Fresno and Bakersfield compete with agricultural users for increasingly scarce water resources, even as Northern California receives substantial precipitation that cannot easily be transferred south due to environmental and political constraints.
Infrastructure Limitations and Regional Barriers
America's water infrastructure was largely built in the mid-20th century for different demographic and climatic conditions. The system of dams, aqueducts, and treatment facilities now serves populations far larger than originally planned, while climate change has altered the precipitation patterns these systems were designed to capture and distribute.
The California State Water Project, completed in 1973, represents both the potential and limitations of large-scale water transfer systems[8]. The project moves water 700 miles from Northern California to Los Angeles and San Diego through a series of pumps, canals, and pipelines. However, environmental concerns about the Sacramento-San Joaquin Delta ecosystem have limited the system's capacity, creating ongoing tensions between urban water needs and ecological preservation.
Interstate water transfers face even greater obstacles. The Great Lakes contain 21% of the world's fresh surface water, yet the Great Lakes Compact of 2008 severely restricts water diversions outside the basin[9]. This means cities like Denver or Albuquerque cannot access Great Lakes water despite facing severe shortages. Political opposition from Great Lakes states, combined with the enormous costs of building transcontinental pipelines, has prevented large-scale inter-regional water transfers.
Texas illustrates the complexity of intrastate water politics. East Texas receives 50+ inches of annual rainfall, while West Texas averages less than 10 inches[10]. The Texas Water Plan calls for moving water from east to west, but rural communities resist selling their water rights to growing cities like Dallas and San Antonio. Legal battles over water rights have delayed projects for decades while cities continue to grow and aquifers continue to decline.
The aging of existing infrastructure compounds these challenges. The American Society of Civil Engineers gave U.S. water infrastructure a C- grade in 2021, citing 2.2 trillion gallons of treated water lost annually to leaky pipes[11]. Cities like Detroit lose up to 40% of their treated water to distribution system leaks, while simultaneously facing budget constraints that prevent major infrastructure upgrades.
Climate Change and Shifting Precipitation Patterns
Climate change is fundamentally altering where and when precipitation occurs across North America, disrupting water supply systems designed for historical weather patterns. The phenomenon of "precipitation whiplash"—rapid alternation between drought and flood conditions—has become increasingly common, making water management more difficult for urban planners.
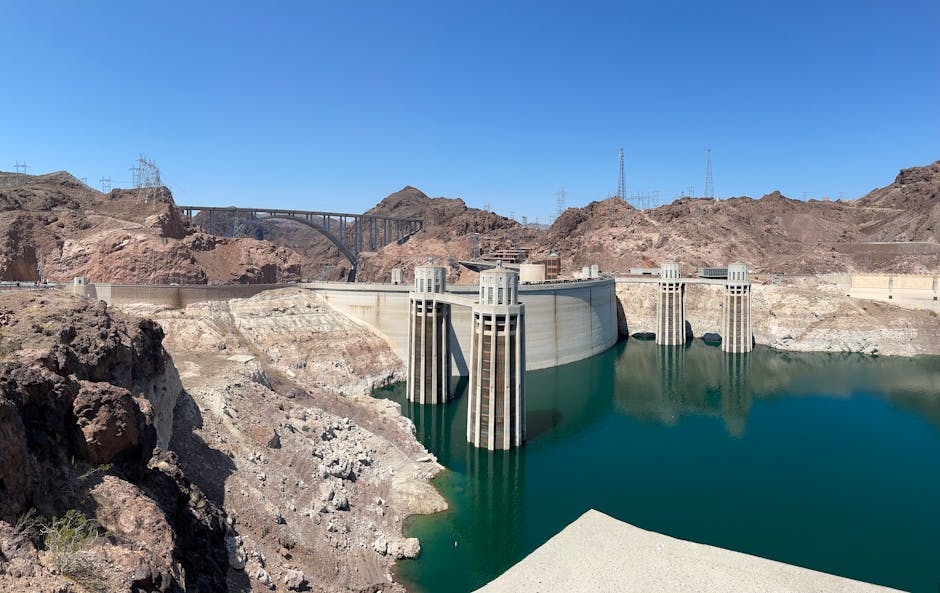
The Colorado River Basin exemplifies these changing patterns. Snowpack in the Rocky Mountains, which provides 60% of the river's flow, has declined by 20% since the 1980s due to rising temperatures[12]. Earlier snowmelt means peak flows occur in spring rather than summer, when agricultural and urban demands are highest. Lake Powell, the system's second-largest reservoir, dropped to 22% capacity in 2022, threatening the ability to generate hydroelectric power at Glen Canyon Dam[13].
California's precipitation patterns have become more extreme and variable. The state experienced its most severe drought on record from 2012–2016, followed by record-breaking rainfall in 2017 that caused widespread flooding[14]. This variability makes it difficult for water managers to balance reservoir levels—storing water for dry periods while maintaining flood control capacity for extreme precipitation events.
The Pacific Northwest, traditionally water-rich, now faces summer water stress as mountain snowpack declines. Seattle's water supply depends on snowmelt from the Cascade Mountains, but rising temperatures have reduced snowpack by 25% since the 1950s[15]. The city has implemented water restrictions during summer months for the first time in its history, despite receiving 38 inches of annual precipitation.
Atmospheric rivers—narrow corridors of concentrated water vapor—have become more intense due to climate change, delivering extreme precipitation to the West Coast while leaving other regions dry[16]. These events can deliver 25% of California's annual precipitation in just a few days, but much of this water runs off to the ocean rather than replenishing reservoirs and aquifers. The mismatch between intense, short-duration precipitation and gradual groundwater recharge exacerbates regional water imbalances.
Urban Growth in Water-Stressed Regions
Population migration to the American Southwest has accelerated despite increasing water scarcity, creating a demographic-resource mismatch that continues to intensify. The Census Bureau projects that Arizona, Nevada, and Utah will be among the fastest-growing states through 2030, adding millions of residents to already water-stressed regions[17].
Phoenix has added over 400,000 residents since 2010, making it the fifth-largest U.S. city despite its desert location[18]. The metropolitan area's water demand has increased 15% over the past decade, even as conservation measures have reduced per-capita consumption. New housing developments continue to be approved in areas that depend entirely on groundwater, depleting aquifers that took thousands of years to fill.
Las Vegas represents both the challenge and potential solutions to desert urbanization. The city has reduced total water consumption by 26% since 2002 despite adding 750,000 residents through aggressive conservation policies[19]. The Southern Nevada Water Authority has banned decorative grass, implemented tiered pricing, and recycled 99% of indoor water use. However, the city still faces severe shortages as Lake Mead continues to decline.
Florida's rapid growth presents different challenges, as the state receives abundant precipitation but faces saltwater intrusion and aquifer depletion. Miami-Dade County has grown by 500,000 residents since 2000, increasing pressure on the Biscayne Aquifer[20]. Rising sea levels push saltwater into coastal freshwater supplies, forcing utilities to drill deeper wells or invest in expensive desalination plants. The city of Hollywood, Florida spent $75 million on a reverse osmosis plant to treat saltwater-contaminated groundwater[21].
Texas cities exemplify the scale of southwestern growth and its water implications. Austin has grown from 465,000 to over 1 million residents since 1990, while San Antonio has added 600,000 people over the same period[22]. Both cities depend heavily on groundwater from the Edwards Aquifer, which has experienced declining levels due to increased pumping and reduced recharge from drought conditions.
Political and Economic Barriers to Water Transfer
Water rights and interstate compacts create legal frameworks that often prevent efficient water allocation across regional boundaries. These agreements, many dating to the early 20th century, were negotiated for different demographic and climatic conditions but remain legally binding despite changed circumstances.
The Colorado River Compact of 1922 allocated 16.5 million acre-feet annually among seven states, based on unusually wet years that overestimated the river's long-term flow[23]. The compact allocated 8.5 million acre-feet to the Upper Basin states (Colorado, New Mexico, Utah, Wyoming) and 8.0 million acre-feet to the Lower Basin states (Arizona, California, Nevada). However, the river's actual average flow is only 14.8 million acre-feet, creating a structural deficit that has grown more severe as demand increased and climate change reduced flows.
Interstate water disputes regularly reach the Supreme Court, creating legal uncertainty that discourages long-term infrastructure investments. The case of Kansas v. Nebraska (2015) involved disputes over Republican River water sharing that took over a decade to resolve[24]. Florida v. Georgia, filed in 2013, concerns water consumption from the Apalachicola-Chattahoochee-Flint River Basin and remains unresolved as of 2024[25].
Economic barriers compound legal obstacles to water transfers. The estimated cost of building a pipeline from the Missouri River to Denver would exceed $20 billion, while a Great Lakes-to-Southwest pipeline could cost over $100 billion[26]. These costs must be weighed against alternative solutions like desalination, water recycling, and demand management, which may be more cost-effective for individual cities.
Water pricing policies often fail to reflect scarcity, encouraging inefficient use in water-stressed regions. Many cities charge flat rates or declining block rates that make water cheaper for high-volume users. Phoenix charges residential customers $3.18 per 1,000 gallons for the first 4,000 gallons monthly, but only $1.68 for usage above 10,000 gallons[27]. This pricing structure subsidizes high water use precisely when conservation is most needed.
Agricultural water rights further complicate urban water access. In California, agricultural users hold senior water rights that give them priority over cities during shortages. The Imperial Irrigation District holds rights to 3.1 million acre-feet annually from the Colorado River—more than the entire state of Nevada—to irrigate crops in the desert[28]. Cities must negotiate expensive transfers or develop alternative supplies rather than accessing agricultural water directly.
Technological Solutions and Their Limitations
Desalination technology offers the potential to create new water supplies for coastal cities, but high costs and environmental concerns limit its widespread adoption. California operates 12 seawater desalination plants with a combined capacity of 58 million gallons daily, providing less than 1% of the state's water supply[29].
The Carlsbad Desalination Plant, which opened in 2015, produces 50 million gallons daily for San Diego County at a cost of $2,000 per acre-foot—nearly four times the cost of imported water[30]. The plant requires 38 megawatts of electricity, equivalent to powering 28,500 homes, and produces 2.2 gallons of brine waste for every gallon of freshwater. Environmental groups have raised concerns about the plant's impact on marine life and coastal ecosystems.
Water recycling technology has proven more cost-effective than desalination for many applications. Orange County's Groundwater Replenishment System treats 130 million gallons of wastewater daily to drinking water standards, then injects it into underground aquifers[31]. The system produces recycled water at $850 per acre-foot, significantly less than desalinated seawater or imported supplies.
Advanced water treatment allows cities to recycle wastewater multiple times. Singapore's NEWater program treats sewage to ultra-pure standards, supplying 40% of the nation's water demand[32]. However, public acceptance remains a challenge in many U.S. cities. San Diego's "toilet to tap" program faced strong public opposition in the 1990s, delaying implementation for decades despite technological feasibility.
Atmospheric water generation represents an emerging technology that extracts moisture from air, potentially providing decentralized water supplies. Companies like Zero Mass Water have deployed solar-powered systems that produce up to 5 gallons daily from atmospheric humidity[33]. However, these systems work poorly in arid climates where water stress is greatest, limiting their application to humid regions that already have adequate water supplies.
Smart water management systems use sensors and data analytics to reduce waste and optimize distribution. The city of Dubuque, Iowa reduced water consumption by 6.8% through a smart meter program that provided real-time usage data to residents[34]. However, these systems require substantial upfront investments and ongoing maintenance that many cash-strapped utilities cannot afford.
Case Studies of Regional Water Crises
Cape Town's near-miss with "Day Zero" in 2018 provides a sobering preview of what American cities may face. The South African city came within 90 days of turning off municipal water supplies entirely, forcing residents to collect water from designated points[35]. Emergency conservation measures, including restrictions on water use to 13 gallons per person daily, helped the city avoid complete system failure. However, the crisis highlighted how quickly urban water systems can collapse when multiple dry years coincide with growing demand.
Chennai, India's sixth-largest city, experienced complete reservoir failure in 2019 when all four major water sources ran dry simultaneously[36]. The city of 7 million people relied entirely on water trucks for several months, with hotels and hospitals drilling emergency bore wells to maintain operations. The crisis demonstrated how urban water systems can fail catastrophically when groundwater depletion coincides with drought conditions.
São Paulo, Brazil faced severe water rationing from 2014–2016 when the Cantareira reservoir system dropped to 5% capacity[37]. The metropolitan area of 22 million people implemented rotating water shutoffs and pressure reductions that affected millions of residents daily. The crisis ended only when unusually heavy rains refilled reservoirs, highlighting the vulnerability of cities that depend on variable precipitation patterns.
American cities have experienced smaller-scale versions of these crises. Jackson, Mississippi's water system failed in 2022 when flooding damaged the main treatment plant, leaving 180,000 residents without safe drinking water for weeks[38]. The crisis revealed how aging infrastructure and deferred maintenance can cause rapid system failures even in water-abundant regions.
Flint, Michigan's water crisis from 2014–2019 showed how cost-cutting measures can compromise water safety and public health[39]. The city's decision to switch water sources without proper treatment led to lead contamination that affected nearly 100,000 residents. While not a scarcity crisis, Flint demonstrated how financial pressures can undermine urban water systems regardless of supply availability.
The framing of this as a "paradox" obscures a more uncomfortable reality: the water crisis in American cities is fundamentally a problem of federal policy and economic incentives, not geography. Cheap, federally-subsidized water actively encouraged settlement and agriculture in the desert for decades, making current shortages less a surprise than a predictable outcome of rational actors responding to distorted price signals. Rather than asking why cities are running out of water, we might ask why we continue subsidizing water consumption patterns that were only ever sustainable under unusually wet historical conditions.
Agriculture's dominance in water consumption—roughly 80% of Western water use—suggests that focusing on urban growth and conservation, while politically easier, may address only the margins of the actual problem. If the real constraint is physical water availability rather than allocation inefficiency, then technological solutions and demand management in cities might be rearranging deck chairs on a ship that was overbooked from the start. The harder question isn't how to make current settlement patterns sustainable, but whether the economics of desert agriculture can survive the removal of the federal subsidies that made it viable in the first place.
Key Takeaways
- Geographic mismatch between precipitation patterns and population centers creates structural water stress, with the Southwest receiving 8–10 inches annually while supporting millions of residents
- Political and legal barriers prevent efficient water transfers between regions, with interstate compacts and water rights laws blocking access to abundant Great Lakes and Eastern water supplies
- Climate change is intensifying precipitation extremes and reducing mountain snowpack, disrupting water systems designed for historical weather patterns
- Rapid urban growth in water-stressed regions like Arizona and Nevada continues despite declining water availability, creating unsustainable demographic-resource imbalances
- Technological solutions like desalination and water recycling offer potential relief but remain limited by high costs, energy requirements, and public acceptance challenges
- Aging infrastructure loses 2.2 trillion gallons annually to leaks while serving populations far larger than originally designed, requiring massive investments to modernize distribution systems
References
- Richter, Brian. Water Share: Using Water Markets and Impact Investment to Drive Sustainability. The Nature Conservancy, 2020.
- U.S. Geological Survey. "Water Resources of the United States." USGS Water Resources, 2023.
- U.S. Census Bureau. "American Community Survey 5-Year Estimates." Census.gov, 2023.
- Bureau of Reclamation. "Colorado River Basin Water Supply and Demand Study." Department of Interior, 2024.
- National Weather Service. "Climate Data for Phoenix, Arizona." NOAA, 2024.
- Arizona Department of Water Resources. "Colorado River Shortage Declaration Impact Report." ADWR, 2022.
- California Department of Food and Agriculture. "California Agricultural Statistics Review." CDFA, 2023.
- California Department of Water Resources. "State Water Project Overview." DWR, 2023.
- Great Lakes Commission. "Great Lakes-St. Lawrence River Basin Water Resources Compact." GLC, 2008.
- Texas Water Development Board. "2022 State Water Plan." TWDB, 2022.
- American Society of Civil Engineers. "2021 Infrastructure Report Card." ASCE, 2021.
- Mote, Philip W. "Climate-driven variability and trends in mountain snowpack in western North America." Journal of Climate, 2023.
- Bureau of Reclamation. "Lake Powell Water Level Report." Department of Interior, 2024.
- California Department of Water Resources. "California Water Year Summary." DWR, 2023.
- Seattle Public Utilities. "Water System Plan Update." SPU, 2023.
- Ralph, F. Martin. "Atmospheric Rivers and Climate Change." Nature Climate Change, 2023.
- U.S. Census Bureau. "State Population Projections 2020–2030." Census.gov, 2023.
- Phoenix Water Services Department. "Water Resources Plan Update." City of Phoenix, 2024.
- Southern Nevada Water Authority. "Water Resource Plan 2024." SNWA, 2024.
- Miami-Dade Water and Sewer Department. "Master Plan Update." Miami-Dade County, 2023.
- City of Hollywood. "Water Treatment Facility Annual Report." Hollywood, Florida, 2023.
- Texas Demographic Center. "Texas Population Projections." TDC, 2024.
- Bureau of Reclamation. "Colorado River Compact Centennial Review." Department of Interior, 2022.
- Supreme Court of the United States. "Kansas v. Nebraska, 574 U.S. 445." SCOTUS, 2015.
- Supreme Court of the United States. "Florida v. Georgia Case Status." SCOTUS, 2024.
- Congressional Budget Office. "Water Infrastructure Investment Analysis." CBO, 2023.
- Phoenix Water Services. "Water Rate Schedule 2024." City of Phoenix, 2024.
- Imperial Irrigation District. "Colorado River Water Rights Documentation." IID, 2023.
- California Water Resources Control Board. "Desalination Plant Inventory." SWRCB, 2024.
- San Diego County Water Authority. "Carlsbad Desalination Project Report." SDCWA, 2023.
- Orange County Water District. "Groundwater Replenishment System Annual Report." OCWD, 2024.
- Singapore Public Utilities Board. "NEWater Programme Overview." PUB Singapore, 2023.
- Zero Mass Water. "Atmospheric Water Generation Technology Report." ZMW, 2023.
- City of Dubuque. "Smart Water Meter Program Results." Dubuque Water Department, 2023.
- City of Cape Town. "Day Zero Crisis Management Report." CCT, 2019.
- Chennai Metropolitan Water Supply and Sewerage Board. "Water Crisis Response Report." CMWSSB, 2020.
- São Paulo State Water Resources Secretariat. "Cantareira Crisis Analysis." SSRH-SP, 2017.
- Mississippi State Department of Health. "Jackson Water Crisis Response." MSDH, 2022.
- Flint Water Advisory Task Force. "Final Report on Flint Water Crisis." State of Michigan, 2016.